Answers about your people and your hours, ready to print.
Pick a report, choose the period (where it has one) and how to group it, and get key figures, a chart and a table. Export the table to a spreadsheet or print it.
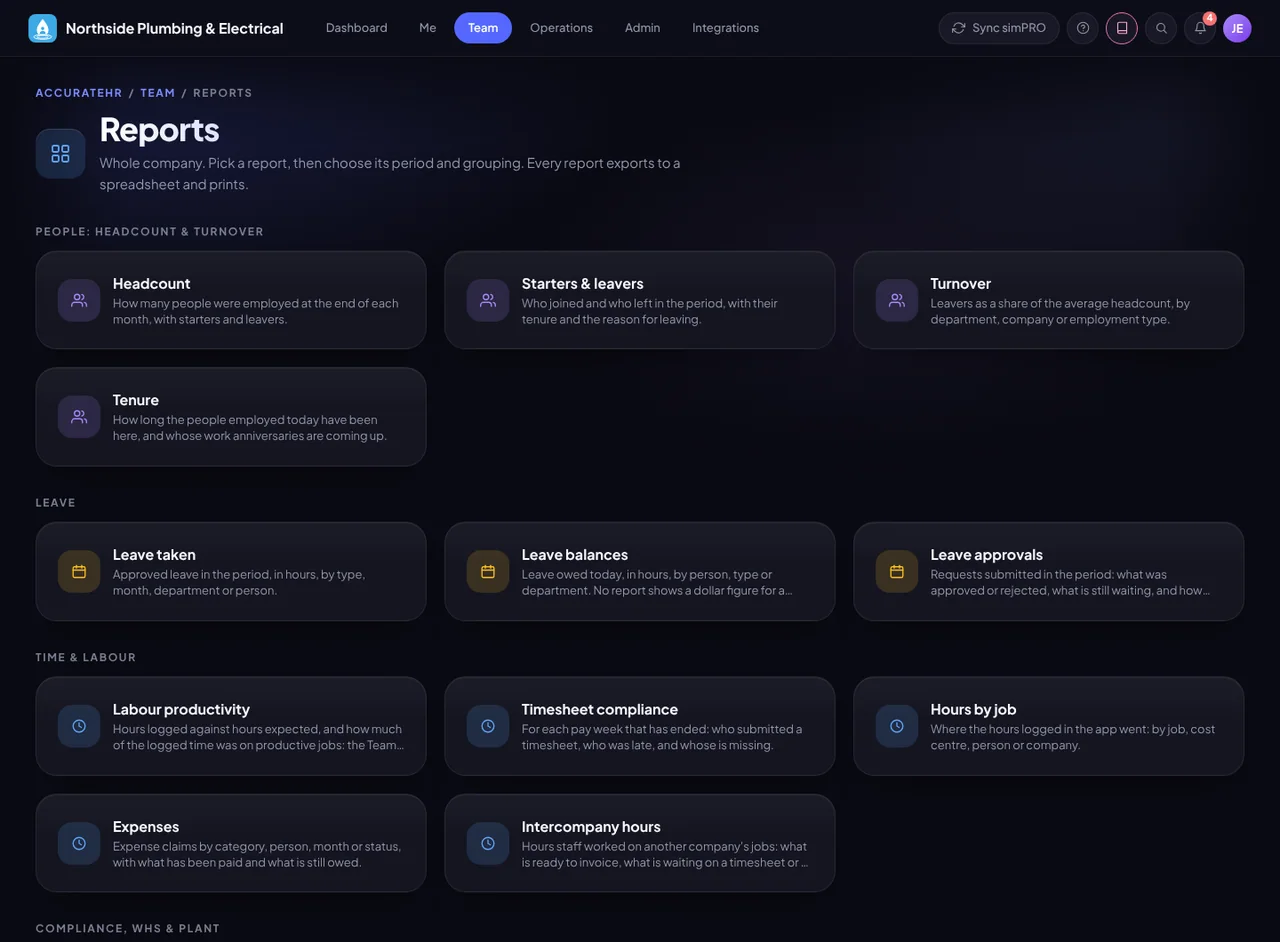
The reports catalogue: people, leave, time and labour, and compliance reports. A screen from the app, showing made-up sample data.
What it does
Reports, in practice.
Four areas of reports
People (headcount, starters and leavers, turnover and tenure), leave (taken, balances and approval times), time and labour (labour productivity, timesheet compliance, hours by job and expenses), and compliance, safety and plant.
Choose the period
Pick a preset, including the Australian financial year (1 July to 30 June), or choose your own dates. A few reports, such as leave balances and tenure, show the position as at today instead.
Group it your way
Where a report allows it, group by month, department, company, type or person.
Figures, chart and table
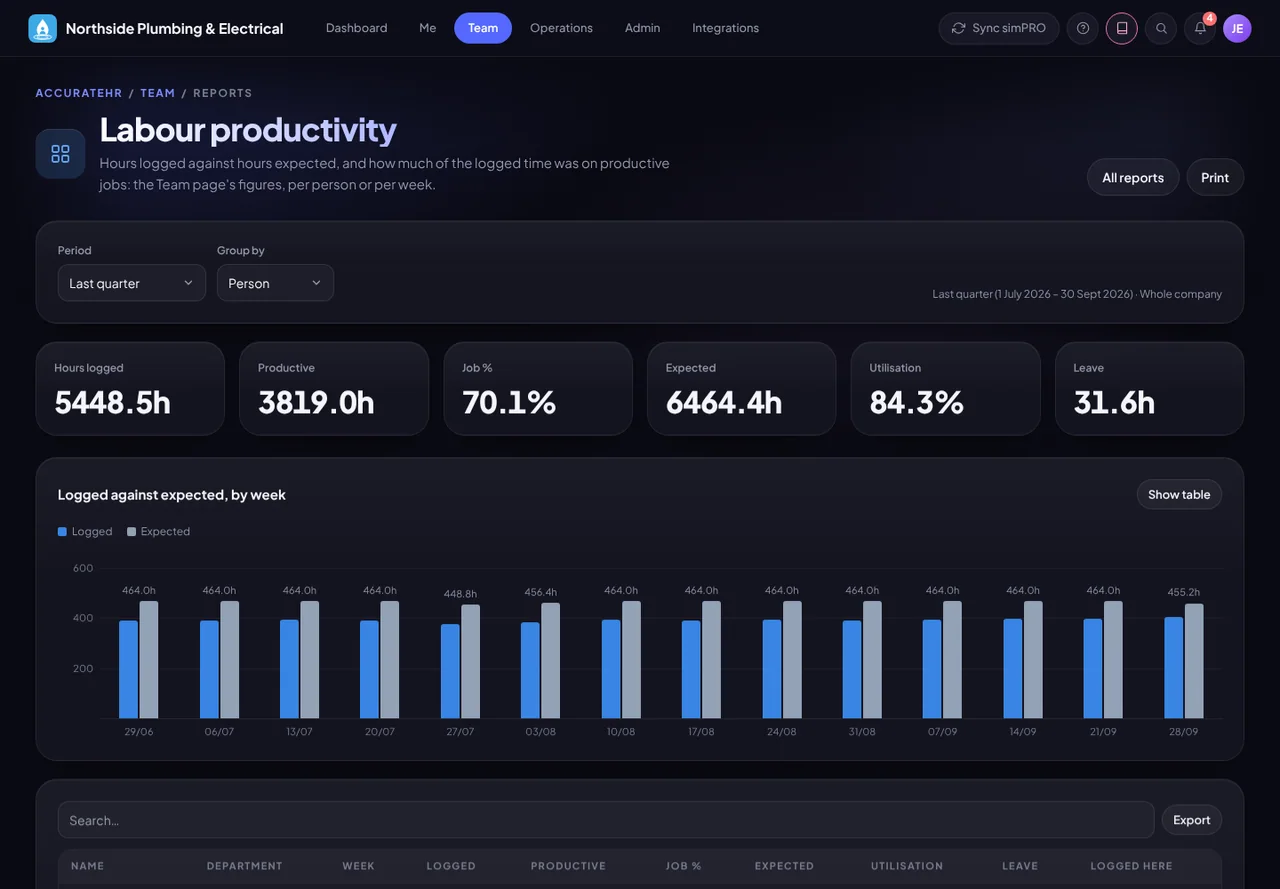
Each report shows key figures and a table of the detail behind them, with a chart when there is something to plot.
Spreadsheet or paper
Export the table to a spreadsheet as CSV, or print the report with the company name on the page and the period where it has one.
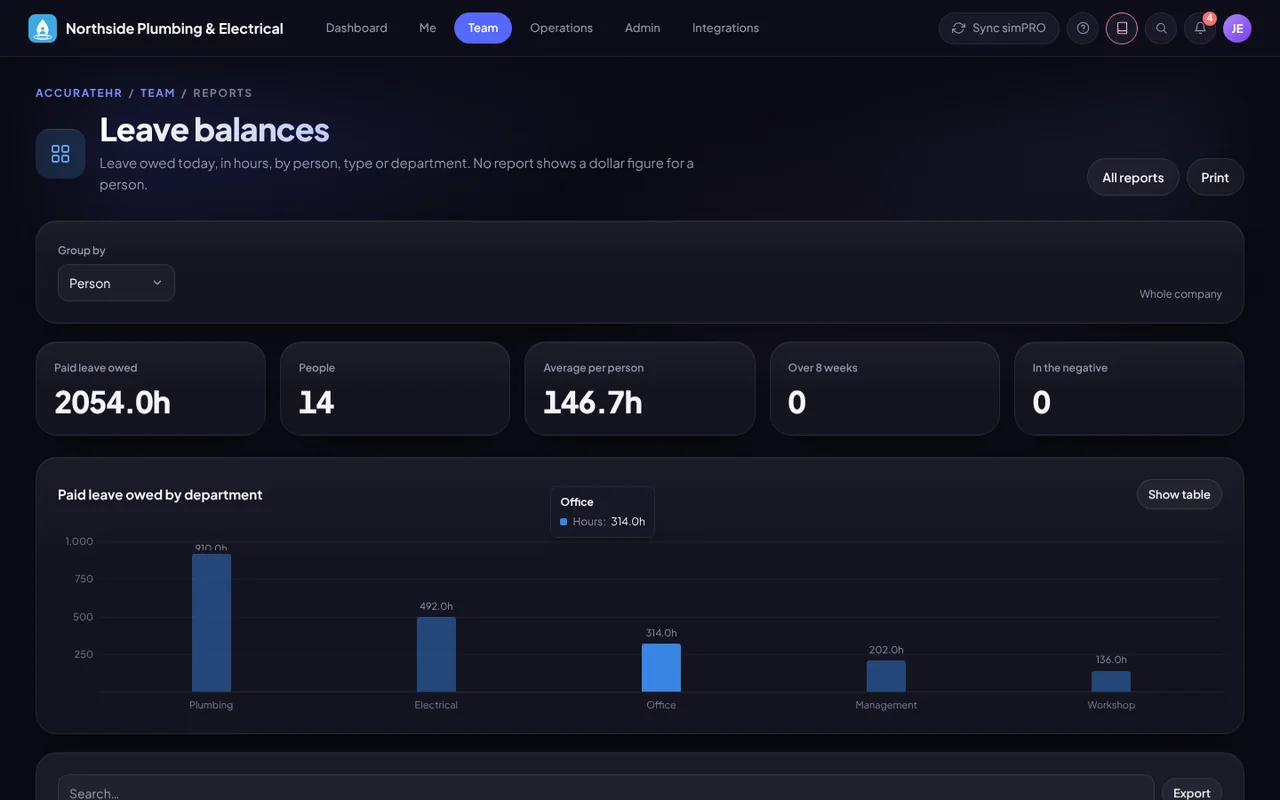
Leave in hours, no pay rates
Leave balances are reported in hours. No report shows the job-costing rates (hourly cost, on-costs, overhead recovery and sell price). Admins can see dollar figures in the Expenses and Intercompany hours reports.
More screens
A closer look.
A report with its period, KPI tiles, chart and table, ready to export or print.
The leave balances report, in hours, by person and leave type.
Who uses it
The right view for each person.
Owners and admins
See reports for the whole company, including the money, safety and plant reports.
Managers
See the people, leave, time and compliance reports for themselves and the people who report to them, and hours on jobs they lead. Money, safety and plant reports are for admins.